Nurse Anesthetist Salary in California: $289,361 (2026)
Quick Answer:Across California's 156 metropolitan areas, the average median nurse anesthetist pay sits at $289,361/year heading into 2026 — a figure projected from 2025 BLS OEWS wage data for SOC 29-1151. Because California sits at BEA RPP 113.1 (13% above the U.S. baseline), that statewide median translates to roughly $255,845 in nationally-comparable purchasing power. Highest-paying metros: Ontario ($302,939), San Bernardino ($299,281), Riverside ($298,910).
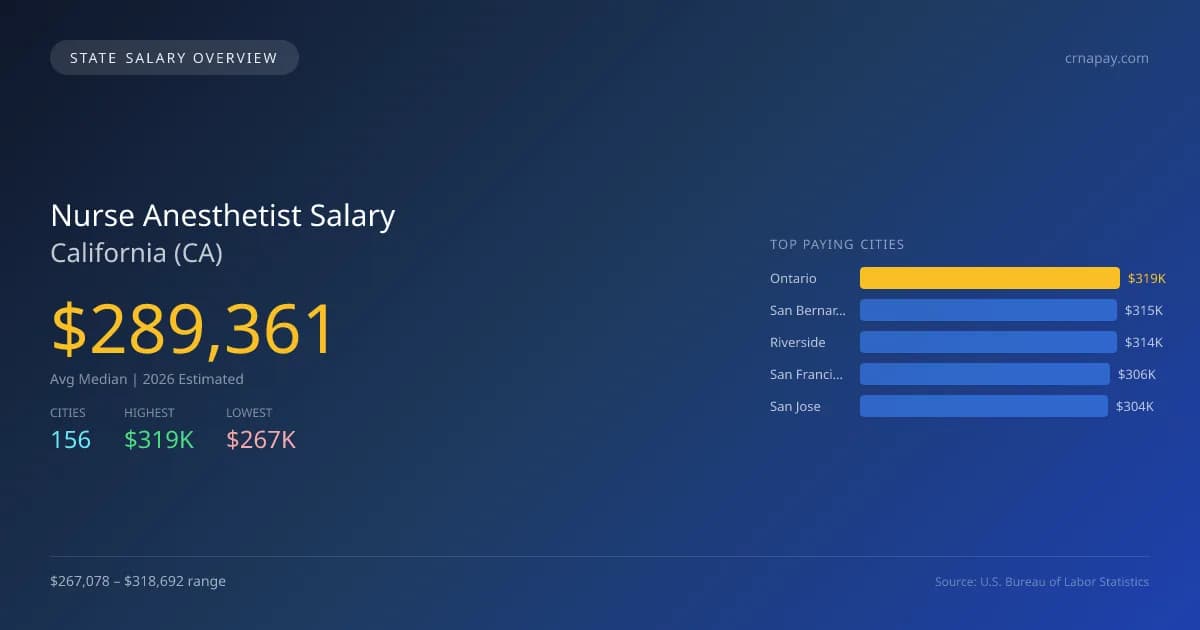
Nurse anesthetists in California are projected to earn an average median salary of $289,361 in 2026, which is 16.3% higher than the national median salary of $248,893. This notable difference reflects California's higher cost of living and significant demand for skilled healthcare professionals. The salary range for nurse anesthetists varies considerably across cities, with the highest paying position in Ontario at $318,692, while the lowest is in Brea at $267,078—creating a gap of $51,614. This disparity can be attributed to factors such as the concentration of healthcare facilities, local economies, and urban versus suburban living conditions. California's requirements for licensing and scope of practice laws create a structured environment for nurse anesthetists, which enhances their professional role and increases demand. The job market strength for this role is expected to grow at an annual rate of 5.20%, driven by an aging population and a continuously evolving healthcare landscape. With a total of 4,423 nurse anesthetists employed in the state, cities like San Bernardino ($314,844), Riverside ($314,453), San Francisco ($306,024), and San Jose ($304,151) are also notable for their competitive salaries, underscoring the promising outlook for this profession in California.
California Nurse Anesthetist Salary Range
Overall salary range in California: $158,621 (lowest entry-level) to $483,188 (highest top earner)
California vs National Average
California nurse anesthetists earn 16.26% more than the national median (+$40,468/year difference).
California Nurse Anesthetist Salary Distribution (2026)
Nurse Anesthetist salaries in California range from $182,447 (entry-level, 10th percentile) to $420,934 (top earners, 90th percentile), with a median of $289,361. The California median is $40,468 above the US national median of $248,893. The average hourly rate is $139.12/hr. Approximately 4,423 nurse anesthetists are employed across 156 cities.
2019 BLS Actual
$203,210
2025 BLS Actual
$275,058
2026 Current Est.
$289,361
2019–2027 Growth
+49.8%
Salary Trajectory for Nurse Anesthetists in California (2019–2027)
2019–2025: actual BLS OEWS data for this metro area. 2026+: CAGR 5.20% projection.
| Year | Annual Salary | Status |
|---|---|---|
| 2019 | $203,210 | Actual |
| 2020 | $213,429 | Actual |
| 2021 | $165,900 | Actual |
| 2022 | $231,110 | Actual |
| 2023 | $247,225 | Actual |
| 2024 | $303,203 | Actual |
| 2025 | $275,058 | Actual |
| 2026(current) | $289,361 | Estimated |
| 2027 | $304,408 | Projected |
Based on 7 years of BLS OEWS data for the California metropolitan area, the median nurse anesthetist salary grew 35.4% from $203,210 (2019) to $275,058 (2025). At a 5.20% compound annual growth rate, salaries are projected to reach $304,408 by 2027 — a total increase of $101,198 (49.80%) from 2019.
Note: Historical values (2019–2025) are actual BLS OEWS figures for the California metropolitan area, sourced from annual Occupational Employment and Wage Statistics surveys. 2026–2026 figures are current estimates, and 2027 values are projections, calculated using a 5.20% CAGR derived from 7-year BLS historical data. Actual salaries may vary based on employer, experience, certifications, and local market conditions.
Top 5 Highest Paying Cities in California
Lowest Paying Cities in California
Best Value Cities for Nurse Anesthetists in California
When adjusted for local cost of living, these California cities offer the most purchasing power for nurse anesthetists.
| City | Nominal Salary | CoL Index | Adjusted Salary |
|---|---|---|---|
| Riverside | $314,453 | 106.442 | $295,422 |
| Ontario | $318,692 | 113.1 | $281,779 |
| San Bernardino | $314,844 | 113.1 | $278,377 |
| San Francisco | $306,024 | 113.1 | $270,578 |
| San Jose | $304,151 | 113.1 | $268,922 |
Adjusted salary = nominal salary × (100 / CoL index). CoL index: 100 = national average. Lower index = lower cost of living.
Salary by Experience Level in California
| Experience Level | Estimated Annual |
|---|---|
| Entry Level (0-2 years) | $182,447 |
| Mid Career (3-7 years) | $289,361 |
| Experienced (7+ years) | $420,934 |
Estimates based on BLS percentile data averaged across California metro areas. Individual pay varies by employer, certifications, and specialization.
All 156 Cities in California
| # | City | Median Salary |
|---|---|---|
| 1 | Ontario | $318,692 |
| 2 | San Bernardino | $314,844 |
| 3 | Riverside | $314,453 |
| 4 | San Francisco | $306,024 |
| 5 | San Jose | $304,151 |
| 6 | Fresno | $303,543 |
| 7 | Anaheim | $302,940 |
| 8 | Oakland | $302,300 |
| 9 | Bakersfield | $301,424 |
| 10 | Sacramento | $300,065 |
| 11 | Long Beach | $298,630 |
| 12 | San Diego | $298,265 |
| 13 | Santa Ana | $298,256 |
| 14 | Los Angeles | $297,642 |
| 15 | Fontana | $292,737 |
| 16 | Irvine | $292,415 |
| 17 | Pomona | $290,988 |
| 18 | Sunnyvale | $290,988 |
| 19 | Simi Valley | $290,829 |
| 20 | Escondido | $290,760 |
| 21 | Chula Vista | $290,278 |
| 22 | Fairfield | $290,237 |
| 23 | Fremont | $290,001 |
| 24 | Stockton | $289,697 |
| 25 | Fullerton | $289,169 |
| 26 | Santa Clara | $289,077 |
| 27 | Daly City | $288,918 |
| 28 | El Monte | $288,828 |
| 29 | Vista | $288,668 |
| 30 | Concord | $288,599 |
| 31 | Clovis | $288,168 |
| 32 | Garden Grove | $287,871 |
| 33 | Temecula | $287,804 |
| 34 | Santa Clarita | $287,612 |
| 35 | Lancaster | $287,235 |
| 36 | Inglewood | $287,235 |
| 37 | Corona | $286,871 |
| 38 | Richmond | $286,826 |
| 39 | Rialto | $286,689 |
| 40 | Torrance | $286,325 |
| 41 | Salinas | $286,007 |
| 42 | Elk Grove | $285,779 |
| 43 | Oceanside | $285,712 |
| 44 | Whittier | $285,627 |
| 45 | San Rafael | $285,604 |
| 46 | Modesto | $285,477 |
| 47 | Rancho Cucamonga | $285,348 |
| 48 | Hayward | $285,188 |
| 49 | Woodland | $285,114 |
| 50 | Buena Park | $285,070 |
| 51 | Encinitas | $285,048 |
| 52 | Downey | $285,029 |
| 53 | Dublin | $284,869 |
| 54 | Redlands | $284,780 |
| 55 | Chino | $284,624 |
| 56 | Westminster | $284,534 |
| 57 | Santa Monica | $284,512 |
| 58 | San Mateo | $284,483 |
| 59 | Tulare | $284,401 |
| 60 | San Buenaventura | $284,301 |
| 61 | Visalia | $284,119 |
| 62 | Mission Viejo | $284,112 |
| 63 | Moreno Valley | $284,108 |
| 64 | Pleasanton | $284,066 |
| 65 | Pasadena | $283,664 |
| 66 | Santee | $283,465 |
| 67 | Glendale | $283,209 |
| 68 | Thousand Oaks | $283,164 |
| 69 | Roseville | $283,141 |
| 70 | Mountain View | $283,064 |
| 71 | Pittsburg | $283,041 |
| 72 | Novato | $282,952 |
| 73 | Costa Mesa | $282,845 |
| 74 | Berkeley | $282,549 |
| 75 | Huntington Beach | $282,481 |
| 76 | Jurupa Valley | $282,232 |
| 77 | Hemet | $282,150 |
| 78 | Union City | $282,126 |
| 79 | West Covina | $282,095 |
| 80 | Chino Hills | $282,015 |
| 81 | Carlsbad | $281,935 |
| 82 | Chico | $281,639 |
| 83 | Gilroy | $281,614 |
| 84 | Santa Maria | $281,526 |
| 85 | Santa Cruz | $281,525 |
| 86 | San Marcos | $281,458 |
| 87 | Tustin | $281,213 |
| 88 | San Ramon | $281,190 |
| 89 | Eastvale | $280,923 |
| 90 | Murrieta | $280,912 |
| 91 | Vacaville | $280,912 |
| 92 | Brentwood | $280,789 |
| 93 | Hesperia | $280,656 |
| 94 | Lake Elsinore | $280,634 |
| 95 | Folsom | $280,566 |
| 96 | Citrus Heights | $280,276 |
| 97 | El Cajon | $280,025 |
| 98 | San Clemente | $279,942 |
| 99 | Bellflower | $279,831 |
| 100 | Palmdale | $279,707 |
| 101 | La Mirada | $279,704 |
| 102 | Apple Valley | $279,652 |
| 103 | Menifee | $279,570 |
| 104 | Yucaipa | $279,451 |
| 105 | Norwalk | $279,433 |
| 106 | Yuba City | $279,318 |
| 107 | Rancho Cordova | $279,184 |
| 108 | Montebello | $278,917 |
| 109 | Compton | $278,805 |
| 110 | Vallejo | $278,637 |
| 111 | Porterville | $278,604 |
| 112 | Lompoc | $278,569 |
| 113 | Hawthorne | $278,136 |
| 114 | Antioch | $278,046 |
| 115 | Burbank | $278,024 |
| 116 | Santa Rosa | $277,682 |
| 117 | Redding | $277,579 |
| 118 | Napa | $277,512 |
| 119 | Alhambra | $277,378 |
| 120 | Livermore | $277,378 |
| 121 | Orange | $277,296 |
| 122 | South Gate | $277,289 |
| 123 | Victorville | $277,227 |
| 124 | West Sacramento | $277,133 |
| 125 | Poway | $277,061 |
| 126 | San Leandro | $276,687 |
| 127 | Indio | $276,375 |
| 128 | Lake Forest | $276,375 |
| 129 | Petaluma | $276,019 |
| 130 | Carson | $275,885 |
| 131 | Rocklin | $275,840 |
| 132 | Newport Beach | $275,372 |
| 133 | Redwood City | $275,349 |
| 134 | Turlock | $275,282 |
| 135 | Manteca | $275,194 |
| 136 | Perris | $275,171 |
| 137 | Madera | $274,948 |
| 138 | Lodi | $274,836 |
| 139 | Baldwin Park | $274,457 |
| 140 | Palo Alto | $274,457 |
| 141 | Lakewood | $274,346 |
| 142 | San Luis Obispo | $274,308 |
| 143 | Hanford | $273,788 |
| 144 | Beaumont | $273,543 |
| 145 | Merced | $273,499 |
| 146 | Tracy | $273,477 |
| 147 | Alameda | $273,387 |
| 148 | Laguna Niguel | $273,320 |
| 149 | Milpitas | $273,187 |
| 150 | Camarillo | $272,607 |
| 151 | Oakley | $272,495 |
| 152 | Davis | $272,429 |
| 153 | Upland | $272,228 |
| 154 | La Habra | $271,826 |
| 155 | Lynwood | $271,715 |
| 156 | Brea | $267,078 |
More California Salary Data
Hourly Rates
Explore nurse anesthetist hourly pay in California cities.
Senior / Experienced
Top earner salaries for experienced nurse anesthetists.
Compare Cities in California
View all comparisons →Explore More Nurse Anesthetist Salary Data
Frequently Asked Questions
How much do nurse anesthetists make in California in 2026?
What is the highest paying city for nurse anesthetists in California?
How does California nurse anesthetist pay compare to the national average?
What is the entry-level nurse anesthetist salary in California?
How many nurse anesthetists are employed in California?
Which California city offers the best value for nurse anesthetists?
Written by Alexandra Johnson, MSN, CRNA
Career Analyst
Alexandra Johnson has 10 years of experience as a nurse anesthetist. She specializes in anesthesia for orthopedic surgeries. She works in a regional medical center.
Methodology & Data Source
Statewide salary figures on this page are 2026 projections based on the Bureau of Labor Statistics Occupational Employment and Wage Statistics (OEWS) survey, May 2026 release. A 5.20% compound annual growth rate (CAGR), derived from 6-year national BLS wage trends, was applied to each metro area's reported salary to estimate current 2026 nurse anesthetist compensation across California. State averages are employment-weighted across 156 metro areas — larger metro areas with more nurse anesthetistscontribute proportionally more to the average, producing figures that better reflect typical compensation. Individual pay varies by city, employer, certifications, and experience.
Data Sources & Methodology
Source: BLS, OEWS, 4-year dataset (–). Per-city data from annual BLS metropolitan area surveys.
2026 figures are projected from 2025 BLS data using a compound annual growth rate (CAGR) of 5.20%, derived from historical BLS wage trends for nurse anesthetists (SOC 29-1151).
Compiled and verified by Alexandra Johnson, MSN, CRNA, a licensed nurse anesthetist with 10+ years of clinical experience. · View source data at BLS.gov