Nurse Anesthetist Salary in Ohio: $238,135 (2026)
Quick Answer:Across Ohio's 67 metropolitan areas, the average median nurse anesthetist pay sits at $238,135/year heading into 2026 — a figure projected from 2025 BLS OEWS wage data for SOC 29-1151. Because Ohio sits at BEA RPP 90.7 (9% below the U.S. baseline), that statewide median translates to roughly $262,552 in nationally-comparable purchasing power. Highest-paying metros: Toledo ($248,100), Beavercreek ($242,798), Dayton ($242,420).
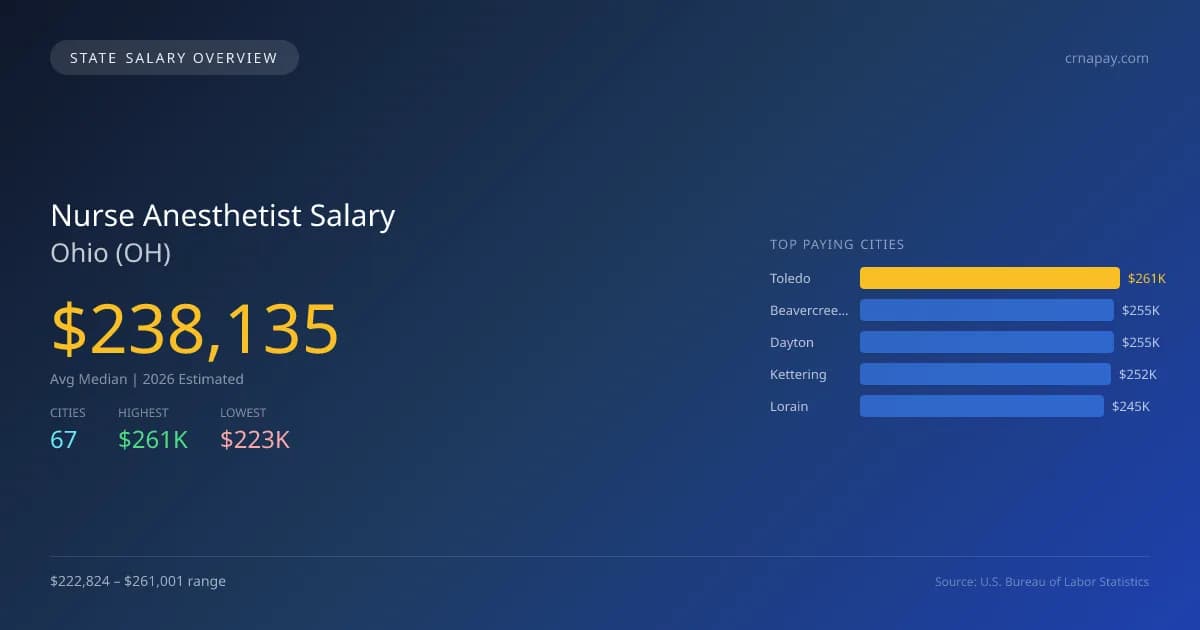
When considering a career as a nurse anesthetist in Ohio, understanding salary dynamics is crucial. As of 2026, the average median salary for nurse anesthetists in Ohio is $238,135, which is 4.3% below the national median of $248,893. Toledo stands out as the highest paying city, offering $261,001, while Akron has the lowest average salary at $222,824, resulting in a gap of $38,177 between these two cities. This disparity can be attributed to varying demand for services, cost of living differences, and the concentration of healthcare facilities in certain urban areas. Ohio's job market for nurse anesthetists is projected to grow at an annual rate of 5.20%, reflecting increasing demand for anesthesia services in both surgical and outpatient settings. The state has specific licensing requirements and scope of practice laws that may influence salary levels and job opportunities, so it's essential for candidates to stay informed. The top paying cities in Ohio, besides Toledo, include Beavercreek at $255,423, Dayton at $255,026, Kettering at $251,588, and Lorain at $245,134. These factors together illustrate that Ohio presents a stable and growing environment for nurse anesthetists, despite the slight salary variation compared to national averages.
Ohio Nurse Anesthetist Salary Range
Overall salary range in Ohio: $74,092 (lowest entry-level) to $431,436 (highest top earner)
Ohio vs National Average
Ohio nurse anesthetists earn 4.32% less than the national median ($-10,758/year difference).
Ohio Nurse Anesthetist Salary Distribution (2026)
Nurse Anesthetist salaries in Ohio range from $182,364 (entry-level, 10th percentile) to $346,097 (top earners, 90th percentile), with a median of $238,135. The Ohio median is $10,758 below the US national median of $248,893. The average hourly rate is $114.49/hr. Approximately 2,323 nurse anesthetists are employed across 67 cities.
2019 BLS Actual
$165,875
2025 BLS Actual
$226,364
2026 Current Est.
$238,135
2019–2027 Growth
+51.0%
Salary Trajectory for Nurse Anesthetists in Ohio (2019–2027)
2019–2025: actual BLS OEWS data for this metro area. 2026+: CAGR 5.20% projection.
| Year | Annual Salary | Status |
|---|---|---|
| 2019 | $165,875 | Actual |
| 2020 | $171,848 | Actual |
| 2021 | $170,405 | Actual |
| 2022 | $177,672 | Actual |
| 2023 | $191,211 | Actual |
| 2024 | $202,922 | Actual |
| 2025 | $226,364 | Actual |
| 2026(current) | $238,135 | Estimated |
| 2027 | $250,518 | Projected |
Based on 7 years of BLS OEWS data for the Ohio metropolitan area, the median nurse anesthetist salary grew 36.5% from $165,875 (2019) to $226,364 (2025). At a 5.20% compound annual growth rate, salaries are projected to reach $250,518 by 2027 — a total increase of $84,643 (51.03%) from 2019.
Note: Historical values (2019–2025) are actual BLS OEWS figures for the Ohio metropolitan area, sourced from annual Occupational Employment and Wage Statistics surveys. 2026–2026 figures are current estimates, and 2027 values are projections, calculated using a 5.20% CAGR derived from 7-year BLS historical data. Actual salaries may vary based on employer, experience, certifications, and local market conditions.
Top 5 Highest Paying Cities in Ohio
Lowest Paying Cities in Ohio
| City | Median Salary |
|---|---|
| Akron | $222,824 |
| Solon | $222,887 |
| Centerville | $222,924 |
| Avon Lake | $223,416 |
| Wadsworth | $223,581 |
Best Value Cities for Nurse Anesthetists in Ohio
When adjusted for local cost of living, these Ohio cities offer the most purchasing power for nurse anesthetists.
| City | Nominal Salary | CoL Index | Adjusted Salary |
|---|---|---|---|
| Toledo | $261,001 | 91.455 | $285,387 |
| Beavercreek | $255,423 | 90.7 | $281,613 |
| Kettering | $251,588 | 90.7 | $277,385 |
| Dayton | $255,026 | 92.694 | $275,127 |
| Mansfield | $241,171 | 88.872 | $271,369 |
Adjusted salary = nominal salary × (100 / CoL index). CoL index: 100 = national average. Lower index = lower cost of living.
Salary by Experience Level in Ohio
| Experience Level | Estimated Annual |
|---|---|
| Entry Level (0-2 years) | $182,364 |
| Mid Career (3-7 years) | $238,135 |
| Experienced (7+ years) | $346,097 |
Estimates based on BLS percentile data averaged across Ohio metro areas. Individual pay varies by employer, certifications, and specialization.
All 67 Cities in Ohio
| # | City | Median Salary |
|---|---|---|
| 1 | Toledo | $261,001 |
| 2 | Beavercreek | $255,423 |
| 3 | Dayton | $255,026 |
| 4 | Kettering | $251,588 |
| 5 | Lorain | $245,134 |
| 6 | Springfield | $244,673 |
| 7 | Parma | $244,462 |
| 8 | Cleveland | $243,885 |
| 9 | Columbus | $243,864 |
| 10 | Cuyahoga Falls | $243,463 |
| 11 | Hamilton | $242,619 |
| 12 | Lakewood | $241,293 |
| 13 | Mansfield | $241,171 |
| 14 | Sandusky | $241,010 |
| 15 | Bowling Green | $240,972 |
| 16 | Lancaster | $240,897 |
| 17 | Zanesville | $240,879 |
| 18 | Westlake | $240,464 |
| 19 | Middletown | $240,370 |
| 20 | Grove City | $239,674 |
| 21 | Delaware | $239,486 |
| 22 | Gahanna | $239,448 |
| 23 | Westerville | $239,297 |
| 24 | Huber Heights | $238,734 |
| 25 | Lima | $238,564 |
| 26 | North Ridgeville | $238,545 |
| 27 | North Royalton | $238,206 |
| 28 | North Olmsted | $237,360 |
| 29 | Reynoldsburg | $236,945 |
| 30 | Youngstown | $236,453 |
| 31 | Strongsville | $236,155 |
| 32 | Warren | $235,816 |
| 33 | Brunswick | $234,686 |
| 34 | Wooster | $234,686 |
| 35 | Elyria | $234,320 |
| 36 | Shaker Heights | $233,845 |
| 37 | Medina | $233,689 |
| 38 | Dublin | $232,937 |
| 39 | Fairfield | $232,918 |
| 40 | Mentor | $232,673 |
| 41 | Cincinnati | $232,671 |
| 42 | Mason | $231,657 |
| 43 | Avon | $231,367 |
| 44 | Marion | $231,017 |
| 45 | Stow | $230,998 |
| 46 | Newark | $230,867 |
| 47 | Findlay | $230,622 |
| 48 | Canton | $230,304 |
| 49 | Green | $230,264 |
| 50 | Barberton | $230,264 |
| 51 | Austintown | $230,170 |
| 52 | Cleveland Heights | $230,132 |
| 53 | Upper Arlington | $229,831 |
| 54 | Xenia | $229,831 |
| 55 | Hilliard | $229,550 |
| 56 | Oxford | $228,833 |
| 57 | Chillicothe | $228,341 |
| 58 | Perrysburg | $227,501 |
| 59 | Trotwood | $227,429 |
| 60 | Massillon | $227,180 |
| 61 | Athens | $225,021 |
| 62 | Tiffin | $223,763 |
| 63 | Wadsworth | $223,581 |
| 64 | Avon Lake | $223,416 |
| 65 | Centerville | $222,924 |
| 66 | Solon | $222,887 |
| 67 | Akron | $222,824 |
More Ohio Salary Data
Senior / Experienced
Top earner salaries for experienced nurse anesthetists.
Compare Cities in Ohio
View all comparisons →Explore More Nurse Anesthetist Salary Data
Frequently Asked Questions
How much do nurse anesthetists make in Ohio in 2026?
What is the highest paying city for nurse anesthetists in Ohio?
How does Ohio nurse anesthetist pay compare to the national average?
What is the entry-level nurse anesthetist salary in Ohio?
How many nurse anesthetists are employed in Ohio?
Which Ohio city offers the best value for nurse anesthetists?
Written by Alexandra Johnson, MSN, CRNA
Career Analyst
Alexandra Johnson has 10 years of experience as a nurse anesthetist. She specializes in anesthesia for orthopedic surgeries. She works in a regional medical center.
Methodology & Data Source
Statewide salary figures on this page are 2026 projections based on the Bureau of Labor Statistics Occupational Employment and Wage Statistics (OEWS) survey, May 2026 release. A 5.20% compound annual growth rate (CAGR), derived from 6-year national BLS wage trends, was applied to each metro area's reported salary to estimate current 2026 nurse anesthetist compensation across Ohio. State averages are employment-weighted across 67 metro areas — larger metro areas with more nurse anesthetistscontribute proportionally more to the average, producing figures that better reflect typical compensation. Individual pay varies by city, employer, certifications, and experience.
Data Sources & Methodology
Source: BLS, OEWS, 7-year dataset (–). Per-city data from annual BLS metropolitan area surveys.
2026 figures are projected from 2025 BLS data using a compound annual growth rate (CAGR) of 5.20%, derived from historical BLS wage trends for nurse anesthetists (SOC 29-1151).
Compiled and verified by Alexandra Johnson, MSN, CRNA, a licensed nurse anesthetist with 10+ years of clinical experience. · View source data at BLS.gov